
The unified workspace for in situ research
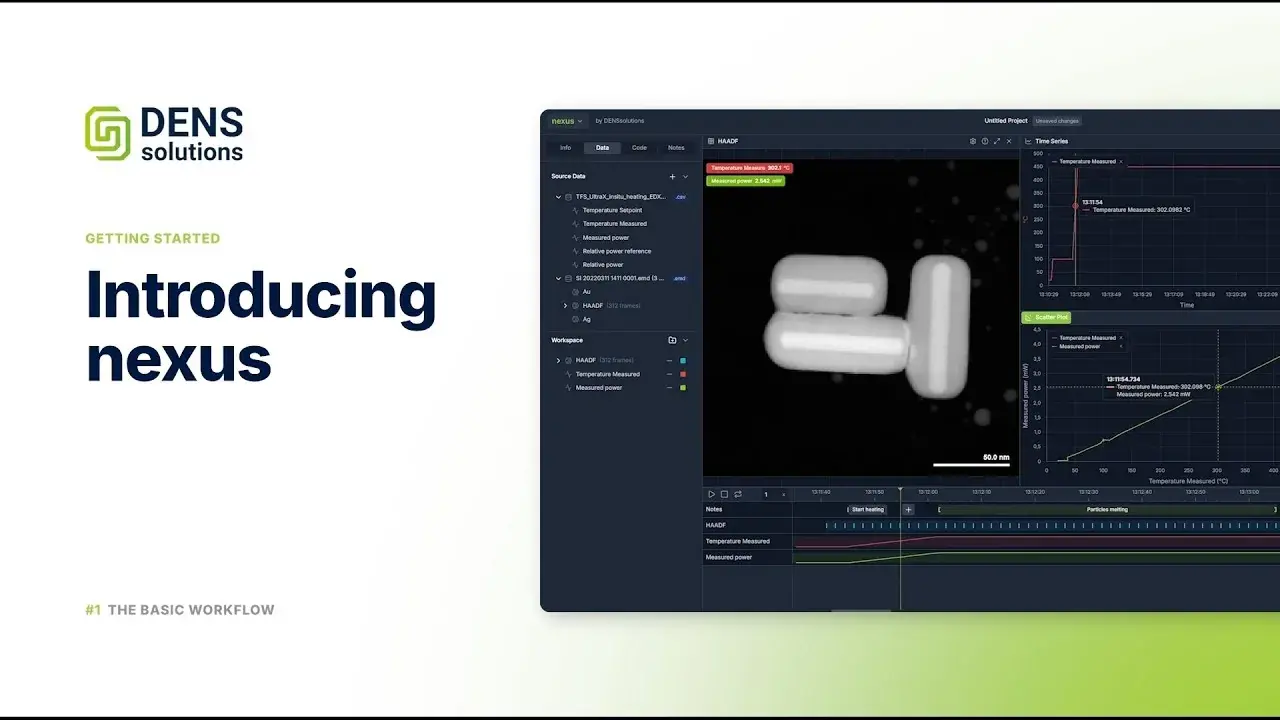
An in situ experiment leaves you with images and condition signals, such as temperature, pressure or voltage, in separate files, often on different clocks. Nexus is a desktop application for in situ research. It reads them into one project, where every image stack, spectrum and condition log becomes a signal on one shared timeline. From there you can annotate, analyze them in Python, and export what you need.
Free download for Windows 10 and 11

Heating experiment
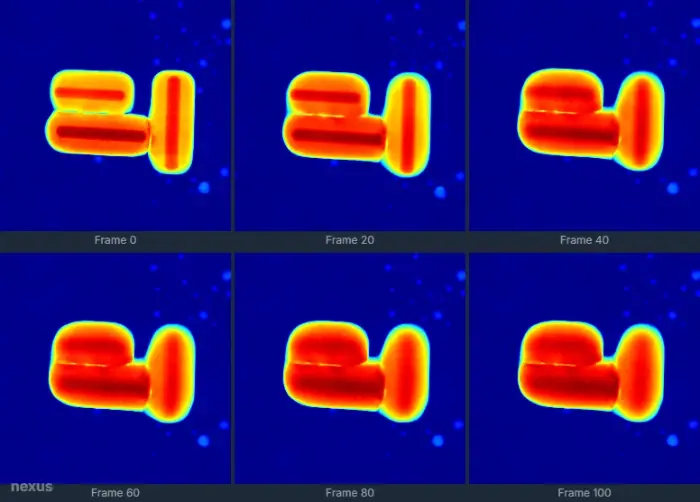
Heating experiment of core-shell particles. Sample is heated up from 100 °C to 450 °C with a ramp-rate of 20 °C/s.
Au core is interdiffusing with the Ag shell.
Key events:
- 14:12:01.403Start heating ramp
- 14:12:07.063Interdiffusion visible
- 14:12:17.651End of heating ramp
- 14:13:28.059Interdiffusion completed
One shared timeline
Images, spectra and condition logs are aligned on a shared timeline. See the whole experiment in one overview, and navigate it with every panel in step.
Analysis in the project
Python runs inside Nexus. The signals a script outputs are added to your project, on the same timeline as the input signals they were derived from.
Provenance
The project keeps the processing steps behind every figure and video you export.
Dataset synchronization & visualization
Nexus imports the image and video files your microscope’s software saves, together with your condition logs. Arrange panels side by side or overlay them, so you can compare signals of different types in one view.
Find the moment that matters
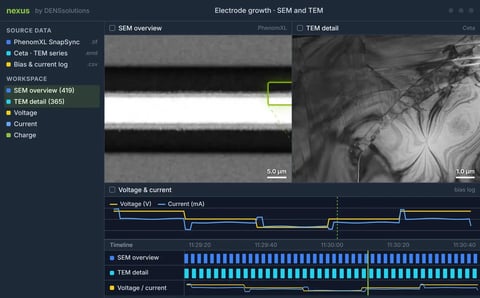
A session can run for hours. The timeline carries the milestones of the experiment, so you can navigate by what happened rather than by the clock. Scrub through the session or zoom into an interval, and every panel follows.
Timestamp notes mark a single instant, timespan notes mark a phase. Notes written during the experiment appear in the same list, so the lab record sits with the data.
See the conditions behind what you’re watching
Imaging sits next to the temperature, pressure, gas flow or electrical signal recorded at the same moment. When a particle begins to sinter or a dendrite begins to grow, the conditions at that instant are on screen rather than in a separate file.
Remove time offsets between datasets
Ideally the clocks are synchronized before the experiment starts. When they are not, the log arrives offset from the images. Shift the whole dataset along the timeline until it lines up, or move a single signal on its own.
Nexus stores the offset with the project, so every panel and every script sees the corrected timing.
Heating experiment
Correlate across length scales
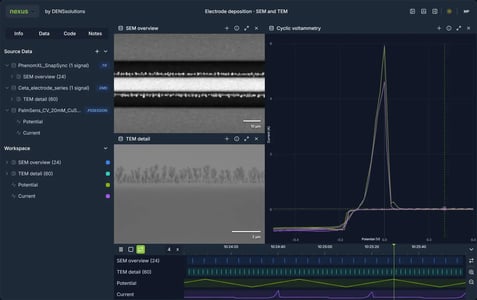
Nexus loads datasets from different instruments into one project, so recordings of the same sample at different length scales sit side by side: an SEM overview of the full structure next to STEM detail of a single feature.
Works with your data
Nexus opens your existing files without a conversion step: the major TEM and SEM formats, your condition logs and their metadata.
Some software cannot save image stacks, and Nexus does not yet read every format. SnapSync records the live view at that software’s own refresh rate and timestamps every frame. Contact us for a copy.
See supported formatsProcess your data with Python
Because Nexus takes care of loading the dataset, storing the results and putting them on screen, a script only has to do the processing. That keeps it independent of the dataset and of the instrument that recorded it, so a routine written once becomes a tool you can apply to any project.
Nexus generates an interface for each script. Dropdowns let you pick signals from your workspace that fit the input types the script requires: one field takes an image time series (2Dts), another a single value over time (0Dts).
Pick values straight from your data
Special fields take parameter values directly from the signals in your project: sample an intensity with the eyedropper, click a coordinate on the image, or set a timestamp by clicking the timeline or any chart in the canvas.
Annotations work as parameters too: a rectangle to crop a dataset, a line to take a spectrum along it, or a point to mark a position.
Done.
Results you can plot, adjust and re-run
Script outputs are ordinary signals. Drag one onto an existing chart to compare it with measured data, or give it a panel of its own, as with any imported signal.
Change a value and re-run, and the signals update in place, along with every panel showing them. The script that produced them stays with them.
Provenance recorded with every result
Provenance is the record of where a dataset came from and what was done to it on the way to a result.
Running a script does not overwrite anything. The project keeps each step with the Python that produced it and the parameters it used, so you can open a result, re-run it, or trace it back to the raw measurement.
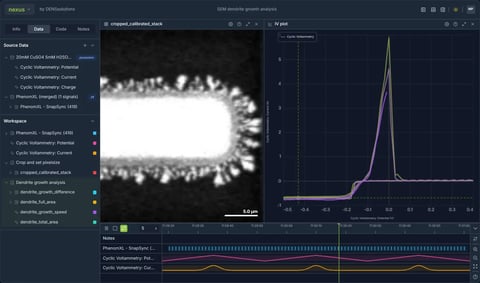
SEM dendrite growth analysis
Running Dendrite growth analysis on PhenomXL - SnapSync (419)
  frames 419 · roi 512x512 · pixel size 25.6 nm
  threshold 41200 · origin (96, 70) · smoothing 11
Wrote dendrite_growth_difference  (2Dts, 419 frames)
Wrote dendrite_full_area          (2Dts, 419 frames)
Wrote dendrite_growth_speed       (0Dts, 419 points)
Wrote dendrite_total_area         (0Dts, 419 points)
Built for FAIR research data
Nexus follows the FAIR principles for research data: Findable, Accessible, Interoperable and Reusable.
Every signal, image and note carries metadata and a synchronized timestamp, so it stays findable inside the project. Projects are ordinary files you can copy and share, and layout, signals, notes and annotations travel with them. Signals are stored with their units and timing, so a result keeps its meaning in other tools, and outputs are written in open formats that anything can read without Nexus.
Findable
Every signal, image and note carries metadata and a synchronized timestamp, so you can find any moment again later. Each signal also records which source file it came from and where that file is stored, so you can trace it back to the original data.
Accessible
Notes, metadata and timestamps stay readable in the project even when the raw data lives elsewhere. Everything sits on your own disk in an open, documented format, with no server, no account and nothing to request access to.
Interoperable
Nexus reads the major TEM and SEM formats and exports standard image, video and CSV files. Projects are stored as SQLite with the workspace state in JSON, both open formats you can read without Nexus.
Reusable
Processed data keeps its metadata and timestamps, so a result stays interpretable long after the session that produced it. Outputs are written in open formats, so anything processed in Nexus can be opened and taken further in other tools.
A library of ready-to-run scripts
Nexus ships with a library of processing scripts, and any of them runs on your data as it is. Edit one or write your own, then publish it to your organization.
How researchers use Nexus
Drift correction

An AuPd particle is held at 800 °C with 40 V applied, and over the five minutes of the recording it drifts a little. Subpixel registration measures how far it wandered between frames and puts every frame back on a common reference; the drift it measured stays in the workspace as its own pair of signals. On the aligned series, lattice segmentation matches the local FFT against the signature of each lattice, giving a similarity map per lattice and the segmentation map drawn over the third panel. The session plays back here at 50x.
Drift correction
Growth analysis

Segment active regions frame by frame and measure how they change, for signed growth maps and area-versus-time traces.
SEM dendrite growth analysis
Spectrograms
Stack per-frame spectra into a time-resolved spectrogram, and watch peaks shift as temperature, potential or gas environment changes.
Heating experiment
Particle analysis

Au nanoparticles imaged in LPTEM. A PCA denoising script from the script library reduces the noise in the original signal, then a particle analysis script marks the particles and returns signals for particle size, number of particles, number of clusters and speed over time.
Particle analysis
Export figures and videos
Export a single frame, a time series as an image layout, or any combination of viewers and charts merged into one video.
Choose which panels appear and at what size, with your annotations included. You get standard image and video files.
Share projects, notes and analysis
Handing an analysis to a colleague usually means a folder of files and a conversation about which is which. In Nexus the whole analysis is one project: layout, signals, notes, annotations and the scripts you ran.
Project packages
Export a project package to bundle layout, signals, notes and annotations into one file. A colleague opens it in the free Nexus app in the state you left it.
Time notes
Time notes and annotations mark specific moments or features. Clicking one moves the timeline to that point.
Interdiffusion onset at 14:12:07.063, fully mixed by 14:13:28.059 , consistent with the 450 °C plateau.
Built-in text editor
Write observations, hypotheses and conclusions next to the data, with links to specific timestamps.
Watch how it works
More walkthroughs coming soon
Frequently asked questions
Practical questions about running Nexus.
Does Nexus require DENSsolutions hardware?
No. Nexus reads the major TEM and SEM formats from any vendor, so a group running holders from someone else can use it on their own data. Our own hardware is one supported source among several, not a requirement.
How does Nexus relate to Impulse?
Impulse controls the in situ experiment; Nexus is where you analyze what it recorded. Impulse logs import directly and land on the same timeline as the images from your TEM or SEM, so conditions and imaging line up without manual matching. Impulse isn’t required. Nexus reads data from other instruments and vendors the same way.
What does Nexus cost?
Nothing. Nexus is free to download and use.
If we introduce paid tiers for advanced capabilities in future, we’ll say so clearly and well in advance. Opening, viewing and sharing projects will stay free, so a project you create today will always be openable by you and by anyone you send it to.
What does Nexus run on?
Windows 10 and 11. There is no macOS or Linux build yet.
Does my data stay on my machine?
Yes. Nexus is a desktop application and projects are ordinary files on your own disk. Nothing is uploaded. Data leaves your machine only when you export a project package and send it yourself.
Which file formats can Nexus open?
Nexus reads the major TEM and SEM formats directly, including .emd (Velox), .dm3 and .dm4 (Gatan), .ser and .emi (TIA) and vendor .tiff series, along with condition logs such as Impulse .csv. The full list is in the documentation.
Do I need to know Python to use Nexus?
No. Importing, synchronizing, annotating and exporting require no code. The script library ships with ready-to-run scripts, and the script interface presents parameters, inputs and outputs as a form, so you can run one on your project without touching its code. Writing your own takes a few lines in the built-in editor.
Can colleagues open my project without preparing anything?
Yes. Export a project package and send it. They open it in Nexus with the layout, notes, annotations and signals as you left them.
What happens to my analysis results?
They land in the project as ordinary signals, with the code and parameters that produced them. See provenance above.
Can I get my data back out?
Yes. Any signal, figure or video exports as a standard image, video or CSV file. Your original data files stay where they are; a project references them rather than taking them over.
How do organization script libraries work?
Publish a script once and anyone in your organization can run it on their own data.
Download Nexus
Nexus is free to download and use.
Free download for Windows 10 and 11